
Another day, another Google metric come and gone. On September 30th, 2019, we laid the average position to rest.
If you’ve been justifying your performance with average position and its absence has you wondering how to carry on in the curious world of search, worry not, Google wouldn’t have removed it if there were not greater metrics on the horizon or hidden in the platform already.
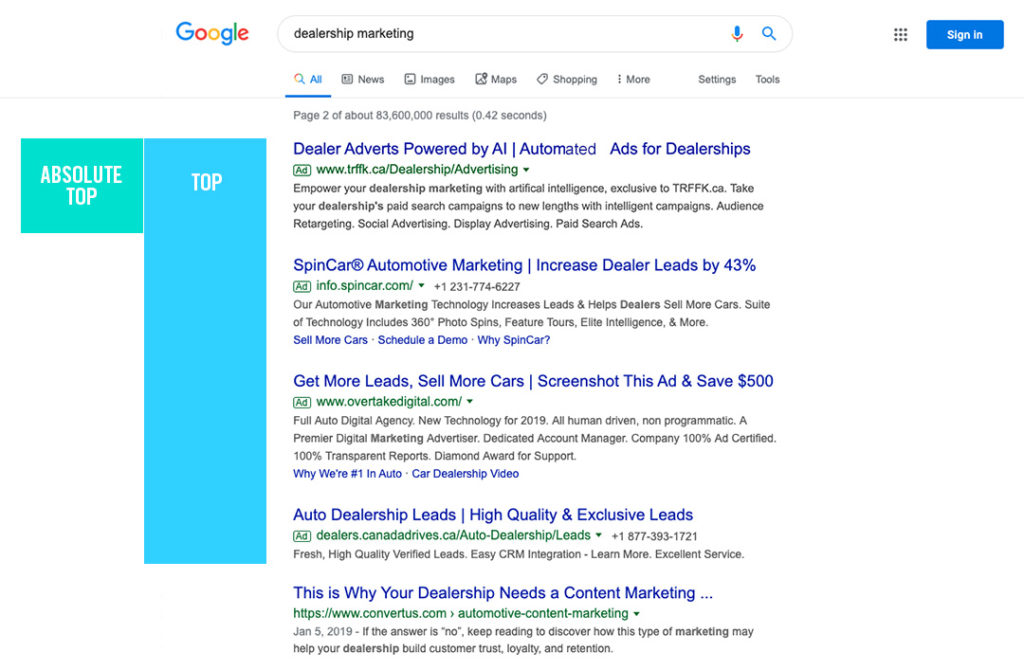
Enter the average position 2.0 metrics; Search Top Impression Share (Top %) and Search Absolute Top Impression Share (Absolute Top %):
Top and absolute top are the prime real estate we’re all fighting for. Both indicate the percentage of auctions that your ads were shown above the organic search results in either spots, focusing solely on your ad placement. Whereas average position calculated where you ranked compared to other ads.
Beyond these intuitive replacements to the average position, here are a few other metrics to consider when optimizing your campaigns:
Impression Share (IS) & Click Share
Out of the impressions and clicks your campaigns generated, what percentage of auctions did you miss out on overall, or if you’re a glass half full kind of person, what percentage of impressions and interactions do you have the potential to be a candidate for? In Google’s term: the number of impressions/clicks received ÷ the estimated number of impressions/clicks you were eligible to receive. The good news is you’ve got a piece of the action, now it’s on you to analyze, strategize and optimize accordingly to increase that percentage and presence.
Search Lost (IS) Rank
Time to face reality – there are only so many external factors we can blame before admitting we are the problem. It’s your time to shine. Take a deep dive, pause, restructure and make the necessary adjustments on the keyword, ad group and ad level to boost that rank. Remember the two main factors in your ad position and it being shown at all relies on your ad quality and bid compared to your competitors. Take a look at the factors that could be negatively affecting your quality score and, in turn, the user’s experience: clickthrough rate (CTR); keyword, ad, and landing page quality and relevance.
Search Lost (IS) Budget
There’s only so far thin you can spread a budget without sacrificing performance. Ever wondered just how much action you were missing in the search auctions because of your limited budget? This metric calculates just that. If you have a limited budget, look over the data and let it speak volumes on how to make the necessary adjustments to your campaign, (ad schedule, geo targeting, device attribution, keywords, bids, networks, etc.), before digging deeper into your pockets.
Auction Insights
You are not alone. Curious to see who you’re competing against in the auctions and where you stand amongst them? Pull up the auction insights report, available on the campaign, ad group, and keyword level, to find out just that.
Although every industry and location vary greatly in terms of strategy and budget needed to meet KPIs, it all comes down to showing the value digital marketing brings to your business. By adding these key metrics to your toolbox, we’ll be able to better identify and understand the data in order to optimize your campaigns, and have the advantage of providing tailored recommendations to enhance your campaigns with undeniable Google facts.